|
|
Study of the Dispersion of the Covariance Matrix Diagonaldate:25/05/09 What does the Diagonal look like?
|
| group/runname | simupapier6 |
| bolo | 143-5 |
| nSide | 512 |
| IMO | '1127593' |
| signal name | 'cmb_gal_dipcosmo_gauss' |
| first ring | 580 |
| last ring | 13080 |
| Noise | White Noise (WN) sigma=62e-6 |
Commentary:
- simupapier6 corresponds to the new PPL (with the long ring) and in LSCmission mode_phase_pointing="random" (not "ideal")
A Diagonal:
Hereafter the diagonal of the covariance matrix of Offsets obtained with the MC simulation.
The results below are for 1000 simulations of noise.
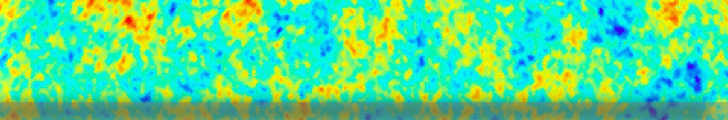
| Diagonal |  |
| Diagonal normalised wr2 its mean |  |
| Difference between the MC Diagonal and the PolkaCov Diagonal |  |
| Histogram of the dispersion |  |
Commentary:
- The diagonal has the same shape as the weight per ring (see graph below). It's an image of the PPL! You can see for example the long ring in the middle. (see nside dependence for more explanation).
On the graph below, the polkapix covariance diagonal is also plotted in red.

- On the first plot, the polkapix covariance diagonal can't be observed because it's higher (~10e-6). That is why it's normalised after (second plot). The mean value of the Polkapix Covariance Diagonal and the MC Diagonal are correlated to the amplitude of noise. Indeed, the Polkapix Covariance Diagonal is in sigma-unity.
| PolkaCov Diag mean | 2.2214088e-06 |
| MC Diag mean | 1.4702191e-12 |
| ratio | 6.61841e-07 |
| sqrt(ratio) | 8.13536e-04 |
| sigma | 62e-06 |
| sample freq | 172.18 |
| sigma/sample = sigma*sqrt(sample_freq) | 8.13548e-04 |
Ok, sigma/sample and sqrt(MC Diag mean / PolkaCov Diag mean) are close.
The level of the MC diag is correct !!!
- The noise on the Diagonal (see the third plot: Difference between the MC Diagonal and the PolkaCov Diagonal) isn't uniformly gaussian! There is still a correlation between the amplitude of this noise (or the standard deviation) and the local mean value of the diagonal.
Correlation between the diagonal dipersion and the number of MC simu:
| Diagonal |  |
| Diagonal normalised wr2 its mean |  |
| Difference between the MC Diagonal and the PolkaCov Diagonal |  |
| Histogram of the dispersion |  |
| Gaussian Fit of the Histogram |  |
| Standard Deviation VS 1/sqrt(nb simu) |  |
Commentary:
- The diagonal dispersion is proportionnal to the inverse of the square root of the number of MC simu used.
OK! This is the expected behaviour.